
In 2017, social protection expenditure per capita in PPS (Purchasing Power Standards), which eliminates price level differences between countries, showed large differences between EU member states. After Luxembourg, the highest expenditure per capita was recorded in Denmark (almost 12 thousand PPS), Germany, the Netherlands, Austria and France (all around 11 thousand PPS).
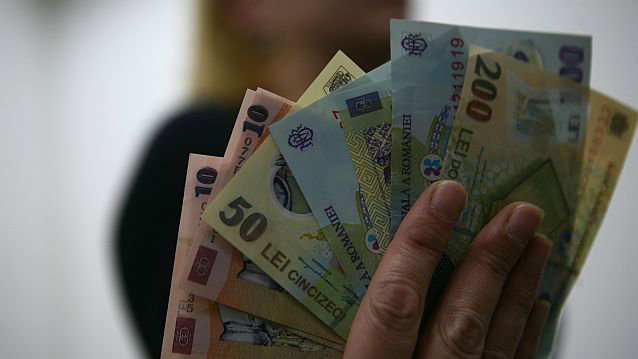
In contrast, the lowest expenditure per capita was registered in Bulgaria, Romania and Latvia (3 thousand PPS or less).
Social protection expenditure in the European Union stood at 27.9% of GDP in 2017, slightly down compared with 28.7% in 2012.
The two main sources of funding of social protection at EU level were social contributions, making up 55% of total receipts, and general government contributions from taxes at 40%.
In 2017, social protection expenditure represented over 30%of GDP in France(34%), Denmark (32%) and Finland (31%). They were followed by Germany (close to 30%), Austria, the Netherlands, Italy, Belgium and Sweden (all 29%).
In contrast, social protection expenditure stood below 20% of GDP in Romania (14%), Latvia, Ireland and Lithuania (all 15%), Estonia and Malta (both 16%), Bulgaria (17%), Slovakia and Hungary (both 18%), Cyprus and Czech Republic (both 19%).