
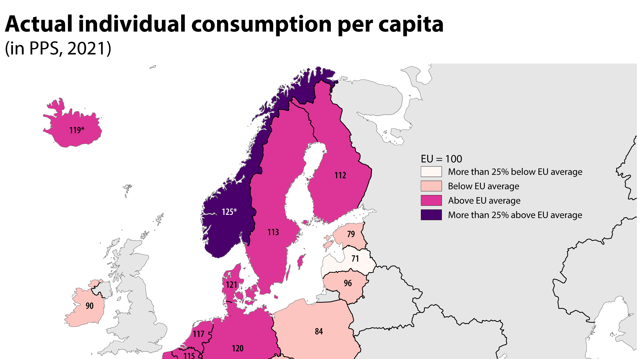
In Denmark, Germany, Netherlands, Belgium, Austria, Sweden, Finland and France, the levels were 10% or more above the EU average.
In thirteen Member States, AIC per capita was between the EU average and 25% below. In this category, there were significant differences across the Member States: in Italy, Lithuania, Cyprus and Ireland, the levels were 10% or less below the EU average, while Slovenia, Spain, Czechia, Poland, Portugal, Malta and Romania were between 11% and 20% below. Estonia and Greece were 21% and 23% below the EU average, respectively.
Five Member States recorded AIC per capita 25% or more below the EU average. Croatia, Latvia, Hungary and Slovakia were between 27% and 30% below, while Bulgaria recorded AIC per capita 37% below the EU average.
Gross domestic product (GDP) per capita, a measure of economic activity, also shows substantial differences across the EU Member States.
In 2021, GDP per capita expressed in Purchasing Power Standards (PPS) ranged between 55% of the EU average in Bulgaria and 277% in Luxembourg. Ten Member States recorded a level of GDP per capita above the EU average in 2021.
AIC is a measure of material welfare of households. In 2021, AIC per capita expressed in PPS varied from 63% to 146% of the EU average across the 27 Member States.